Global governance-related funding is anything but steady. Between 2019 and 2022, government donor disbursements for transparency, participation, and accountability shot up by 36% (from $27.6 billion to $37.6 billion), only to dip again in 2023. This volatility highlights how global crises, from the pandemic to Russia’s invasion of Ukraine, have been reshaping donor priorities.
Now, with TAI’s latest Power BI dashboard, you can explore these trends yourself, comparing flows across regions, sectors, and funders over a full five-year period (2019–2023).
The interactive dashboard lets you track funding across these years through a comprehensive, user-friendly, and interactive design. Whether you’re a policymaker, funder, researcher, or simply curious about the flow of resources behind today’s global governance debates, this tool offers a deeper dive into where the money is coming from, where it’s going, and what it’s meant to achieve.
It does not yet reflect funding dips in 2024 and the major cuts this year, but it serves as a useful reminder of the baseline and range of funding now at risk. We look forward to updating the data as soon as donors report new figures. You can already see preliminary numbers for 2024 from the OECD, but not yet with the governance code breakdowns.
Explore the 2019–2023 Dashboard here:
Early Findings from the 2019–2023 Dashboard
Our updated dashboard doesn’t just visualize numbers; it surfaces revealing patterns in how governance and accountability are being resourced. A few interesting highlights:
Top benefitting regions and countries
Ukraine was the top global recipient in 2022–2023, with $10 billion in governance-related grants in 2023 alone, largely targeting public sector capacity and public financial management (PFM).
Africa, historically the largest recipient of governance funding, fell from 34% (2019) to 28% (2023) of the total. In contrast, Europe rose from 7% to around 38% of total funding, driven overwhelmingly by Ukraine-related flows.
Change in sub-sectors
Governance-related funding surged almost 40% from 2019 to 2022, with COVID-19 and Ukraine funding playing key roles. Funding then dipped by around 5% in 2023.
Anti-corruption funding declined through 2023, despite persistent governance risks.
Media funding grew around 10%, with Africa and Asia as the main beneficiary regions.
Funder priorities
Open Society Foundations (OSF) reported $417 million to governance-related purposes in 2023. While a few large grants (e.g., Media Development Investment Fund) stand out, the total appears to be built from more than 1,000 smaller grants.
The Gates Foundation ranks among the largest funders of women’s rights entities at $141 million, behind the Inter American Development Bank at over $503 million and UN Women at over $274 million.
From 2019 to 2023, South Korea increased its grants from $83 million to $133 million. Most of this is to the public sector code, but there were also increases to women’s rights organizations and to end violence against women.
Top PFM funders besides multilateral development banks (MDBs) were France, Japan, Germany, the United States, and the European Union. Japan’s contribution of $216.6 million was almost entirely to Bangladesh ($214 million).
Top domestic revenue mobilization (DRM) funders besides the MDBs were Germany, the European Union, Norway, the United States, the United Kingdom, and Switzerland.
Using the dashboard: What will I find
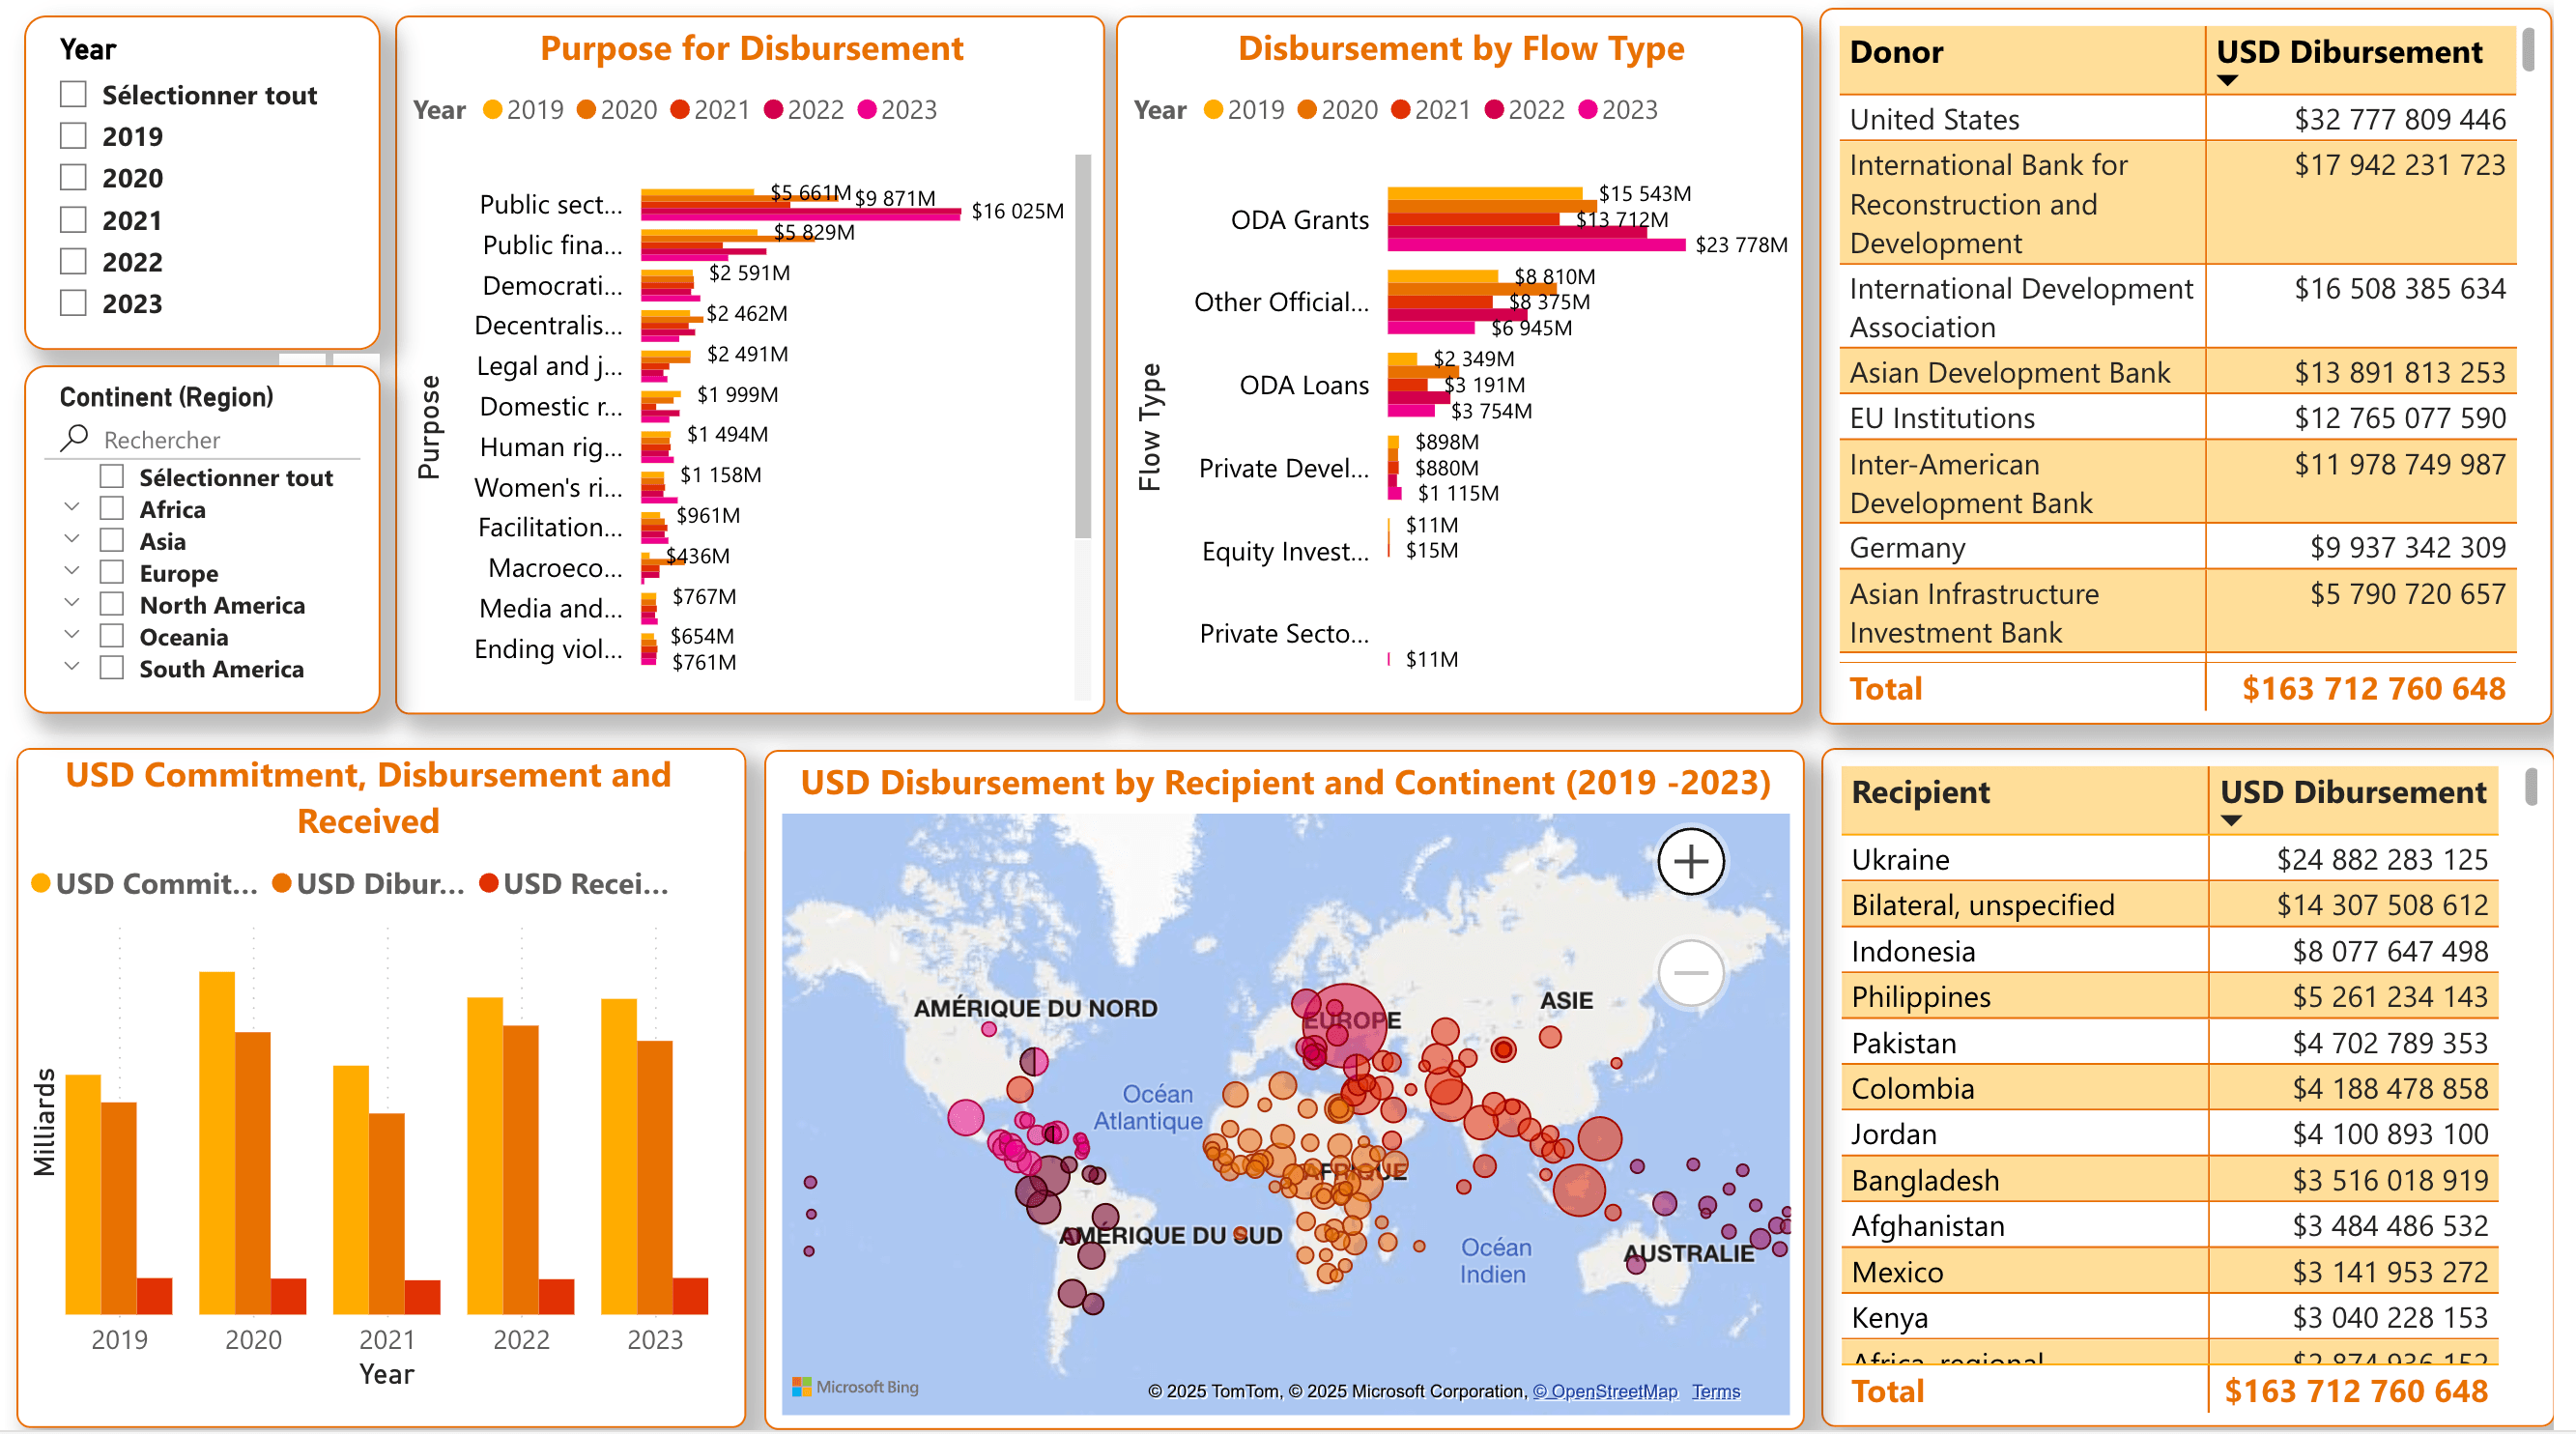
The first screen of the dashboard allows you to tailor your exploration using filters for years and geographies. In addition to these filters, clicking on a purpose, flow type, country, or donor also allows you to drill down by those dimensions.
The “Purpose of Funding” graph breaks down how disbursements are spread across human rights, anti-corruption, legal reform, media freedom, and other governance-related areas. These give you the sense of how funding is spread across issues. See totals for committed, disbursed, and (where available) received funding in the left corner.
The “Disbursement by Flow Type” graph allows you to compare traditional official development assistance (ODA) grants with private development finance (i.e., philanthropy) and other types of flows, giving insight into how different sources of funding are shaping the field.
Additional tables provide “Recipient” and “Donor” analyses, ranking top funders and recipients across years. Unsurprisingly, Ukraine emerges prominently among recipients following Russia’s invasion, and the United States traditionally topped the bilateral donor list. Finally, a Regional Analysis map reveals shifts in geographic allocations.
Click through additional pages 2 to 4 of the dashboard to easily explore funder- and recipient-specific details with sortable lists, now presented in descending order of total disbursements. Navigate funding flows visually with side-by-side maps of countries and continents, providing quick insight into geographic shifts. At the top of every screen, apply filters by year, region, donor, or purpose to quickly tailor the data to your needs.
The numbers tell more than just a story of aid flows: they highlight priorities, shifts, and blind spots in global governance funding.
Final Notes Before You Dive In
All figures are in millions of current U.S. dollars. Unless labeled otherwise, values represent gross disbursements. The source of this data is the OECD DAC Creditor Reporting System. Years correspond to disbursement dates, not project start dates. “Unspecified” categories reflect disbursements not tied to a specific country or not yet allocated at reporting time.
Want more views on OECD data? You should also check out the OECD DAC dashboards, which present data through complementary lenses. For any questions or to request the cleaned backend data, don’t hesitate to reach out to Yery Menendez at [email protected].
Happy data exploring!
You can also check out Beyond the Surface: Navigating the Depths of Governance Funding Trends with TAI's Interactive Data Dashboard.